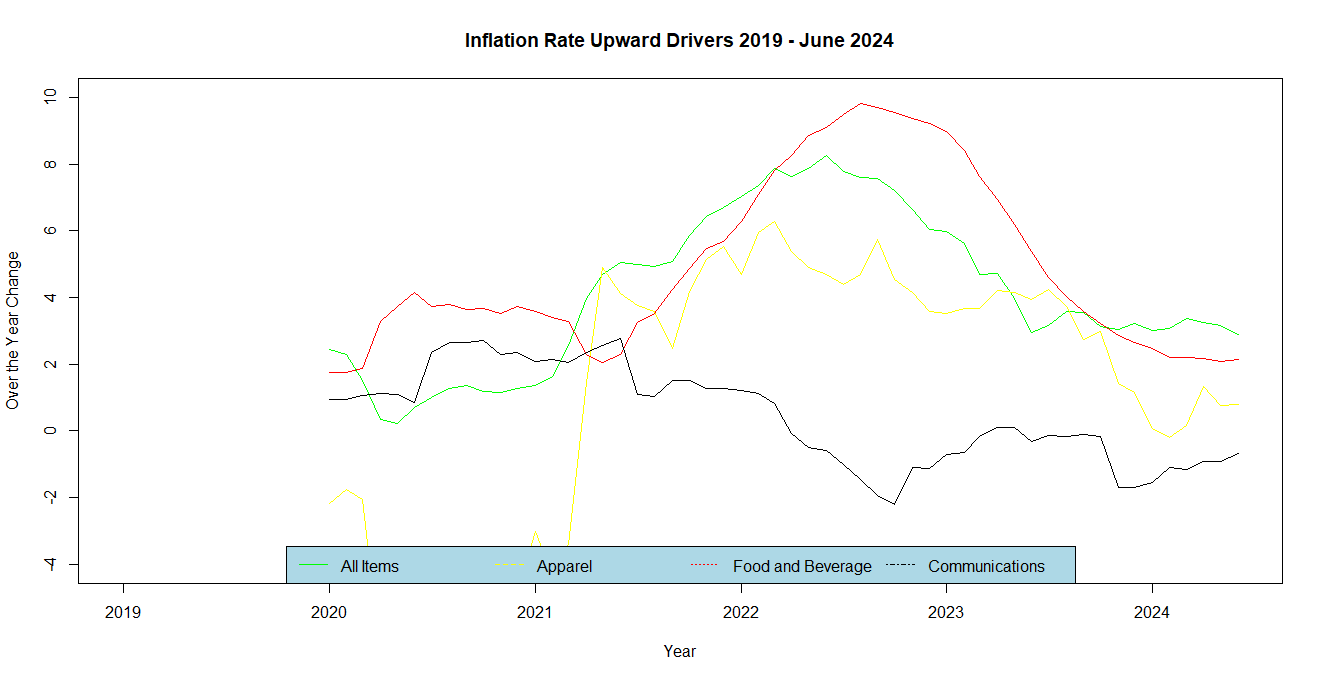
Core Inflation remains over the Federal Reserve Target 2% mostly driven by Cost of Shelter. However, Cost of Shelter shows a lagged effect from monetary tightening. It is a matter of time and more data coming in until we can expect Monetary Officials to think interest rates can be lowered. The Price Index change over the year for All Items less Food and Energy read at 3.17%, accordingly to US Bureau of Labor Statistics data. All items Inflation declined 0.1 percent for All Urban Consumers after seasonal adjustments. The two most volatiles drivers of Inflation “Food” and “Energy” made little difference on the metrics for June 2024. The cost of Food and Beverage along with Apparel and Communications pushed up the metric in the latest data release.
Measures of Core Inflation showed decreases across the board. The Index declines when Energy, Food and Shelter were excluded. June Data showed the cost of Shelter keeps overall cost of living at a high level. Although the trend for shelter has been on a steady decline over the past year, its lagged reaction to monetary tightening may force Monetary Policy Makers to believe that more data is needed.
Further, the Cost of Shelter trend along with Communication and Food and Beverage indicate that prices are way above the FED’s target, therefore expectations for lower Interest Rates may be farfetched at this time of Summer 2024. It seems there is nothing to work on but to wait until, monetary-policy-wise. The wait means monetary tightening or loosening most likely will not happen until there is enough evidence of the delayed effect of monetary tightening over the Cost of Shelter.

BLS Data Series depicted and Code for this post can be seen below:
######################################################################
####                                                             #####
####  CPI and Inflation US Bureau of Labor Statistics            #####
####                                                             #####
######################################################################

##
## Fetch BLS Data
##

Food_Beverage            <- blsR::get_series_table("CUSR0000SAF", start_year = 2019, end_year = 2024)
Housing                  <- blsR::get_series_table("CUSR0000SAH", start_year = 2019, end_year = 2024)
Apparel                  <- blsR::get_series_table("CUSR0000SA311", start_year = 2019, end_year = 2024)
Transportation           <- blsR::get_series_table("CUSR0000SAT", start_year = 2019, end_year = 2024)
Medical                  <- blsR::get_series_table("CUSR0000SAM", start_year = 2019, end_year = 2024)
Recreation               <- blsR::get_series_table("CUSR0000SAR", start_year = 2019, end_year = 2024)
Education_Communication  <- blsR::get_series_table("CUSR0000SAE", start_year = 2019, end_year = 2024)
Other_Goods_Services     <- blsR::get_series_table("CUSR0000SAG", start_year = 2019, end_year = 2024)
Shelter                  <- blsR::get_series_table("CUSR0000SAH1", start_year = 2019, end_year = 2024)
Communication  <- blsR::get_series_table("CUSR0000SAE2", start_year = 2019, end_year = 2024)


Price_Index              <- blsR::get_series_table("CUSR0000SA0", start_year = 2019, end_year = 2024)
All_Items_No_Food        <- blsR::get_series_table("CUSR0000SA0L1", start_year = 2019, end_year = 2024)
All_Items_No_Energy      <- blsR::get_series_table("CUSR0000SA0LE", start_year = 2019, end_year = 2024)
All_Items_No_Shelter     <- blsR::get_series_table("CUSR0000SA0L2", start_year = 2019, end_year = 2024)
All_Items_No_Food_Energy <- blsR::get_series_table("CUSR0000SA0L1E", start_year = 2019, end_year = 2024)
All_Items_No_Food_Energy_Shelter <- blsR::get_series_table("CUSR0000SA0L12E", start_year = 2019, end_year = 2024)

##
## Parse New Dates sort Time Series
##


Date_Parser <- function(Data){
  Real_Estate_Comp <- Data
  Real_Estate_Comp$Date <- as.Date(paste("01", Real_Estate_Comp$periodName, Real_Estate_Comp$year), tryFormats = "%d %B %Y")
  Real_Estate_Comp
}

##
## Calculate Over the Year Price Index Change (Inflation)
##

Inflation_Calculator <- function(Data){
  Price_Index <- Data

Price_Index$Laged_Year_Value      <- Price_Index[as.numeric(rownames(Price_Index))+12,]$value
Price_Index$Over_Year_Inflation   <- ((Price_Index$value - Price_Index$Laged_Year_Value)/Price_Index$value)*100

Price_Index$Laged_Month_Value     <- Price_Index[as.numeric(rownames(Price_Index))+1,]$value
Price_Index$Over_Month_Inflation  <- ((Price_Index$value - Price_Index$Laged_Month_Value)/Price_Index$value)*100
Price_Index
}


Price_Index         <- Date_Parser(Price_Index)
Price_Index         <- Inflation_Calculator(Price_Index)
All_Items_No_Energy <- Date_Parser(All_Items_No_Energy)
All_Items_No_Energy <- Inflation_Calculator(All_Items_No_Energy)


All_Items_No_Food_Energy <- Date_Parser(All_Items_No_Food_Energy)
All_Items_No_Food_Energy <- Inflation_Calculator(All_Items_No_Food_Energy)
All_Items_No_Shelter     <- Date_Parser(All_Items_No_Shelter)
All_Items_No_Shelter     <- Inflation_Calculator(All_Items_No_Shelter)


All_Items_No_Food_Energy_Shelter <- Date_Parser(All_Items_No_Food_Energy_Shelter)
All_Items_No_Food_Energy_Shelter <- Inflation_Calculator(All_Items_No_Food_Energy_Shelter)


Shelter       <- Date_Parser(Shelter)
Shelter       <- Inflation_Calculator(Shelter)
Apparel       <- Date_Parser(Apparel)
Apparel       <- Inflation_Calculator(Apparel)
Energy        <- Date_Parser(Energy)
Energy        <- Inflation_Calculator(Energy)
Housing       <- Date_Parser(Housing)
Housing       <- Inflation_Calculator(Housing)
Food_Beverage <- Date_Parser(Food_Beverage)
Food_Beverage <- Inflation_Calculator(Food_Beverage)

Education_Communication <- Date_Parser(Education_Communication)
Education_Communication <- Inflation_Calculator(Education_Communication)


Recreation <- Date_Parser(Recreation)
Recreation <- Inflation_Calculator(Recreation)

Transportation <- Date_Parser(Transportation)
Transportation <- Inflation_Calculator(Transportation)

Communication <- Date_Parser(Communication)
Communication <- Inflation_Calculator(Communication)

##
## Plot the Series
##


plot(Price_Index$Over_Year_Inflation ~ Price_Index$Date, type="l",
     ylim=c(-.6,10),
     col="green",
     xlab = "Year",
     ylab = "Over the Year Change",
     main= "US Inflation Rate 2019- June 2024")
lines(All_Items_No_Food_Energy$Over_Year_Inflation ~ All_Items_No_Food_Energy$Date, col= "blue")
lines(All_Items_No_Energy$Over_Year_Inflation ~ All_Items_No_Energy$Date, col= "red")
lines(All_Items_No_Shelter$Over_Year_Inflation ~ All_Items_No_Shelter$Date, col= "black")
lines(All_Items_No_Food_Energy_Shelter$Over_Year_Inflation ~ All_Items_No_Food_Energy_Shelter$Date, col= "yellow")
legend("bottom",c("All Items","All Items No Food Energy", "All Items No Energy", "All Items No Shelter", "All Items No Food Energy Shelter"),
       col= c("green","blue", "red", "black", "yellow"),
       #pch=c("o","*","+"),
       lty=c(1,2,3,4,5),
       ncol = 5,
       bg="lightblue")


plot(Price_Index$Over_Year_Inflation ~ Price_Index$Date, type="l",
     ylim=c(-.6,10),
     col="green",
     xlab = "Year",
     ylab = "Over the Year Change",
     main= "Core Inflation Rate 2019- June 2024")
lines(All_Items_No_Food_Energy_Shelter$Over_Year_Inflation ~ All_Items_No_Food_Energy_Shelter$Date, col= "yellow")
lines(All_Items_No_Food_Energy$Over_Year_Inflation ~ All_Items_No_Food_Energy$Date, col= "blue")
lines(Shelter$Over_Year_Inflation ~ Shelter$Date, col= "red")

legend("bottom",c("All Items","All Items No Food Energy Shelter", "All Items No Food Energy", "Shelter"),
       col= c("green","yellow","blue", "red"),
       #pch=c("o","*","+"),
       lty=c(1,2,3,4),
       ncol = 4,
       bg="lightblue")


plot(Price_Index$Over_Year_Inflation ~ Price_Index$Date, type="l",
     ylim=c(-4,10),
     col="green",
     xlab = "Year",
     ylab = "Over the Year Change",
     main= "Inflation Rate Upward Drivers 2019 - June 2024")
lines(Apparel$Over_Year_Inflation ~ Apparel$Date, col= "yellow")
#lines(Energy$Over_Year_Inflation ~ Energy$Date, col= "blue")
lines(Food_Beverage$Over_Year_Inflation ~ Food_Beverage$Date, col= "red")
lines(Communication$Over_Year_Inflation ~ Communication$Date, col= "black")
#lines(Education_Communication$Over_Year_Inflation ~ Education_Communication$Date, col= "blue")
#lines(Recreation$Over_Year_Inflation ~ Recreation$Date, col= "brown")
#lines(Transportation$Over_Year_Inflation ~ Transportation$Date, col= "pink")
legend("bottom",c("All Items","Apparel", "Food and Beverage", "Communications"),
       col= c("green","yellow","red", "black"),
       #pch=c("o","*","+"),
       lty=c(1,2,3,4),
       ncol = 4,
       bg="lightblue")
Automated Data Reports? This report was Automated by Econometricus LLC. Book a Demo Now!


Categories: Macroeconomics, Policy

2 replies »