Employees quitted jobs at a lower pace gearing up for the summer 2024. Current BLS Quits Data could have spillovers on Monetary Policy, Mortgages, and Remote Work.
Voluntary separations from employment went back to no difference compared to the series long term mean value (excluding 2020 and 2021), which we can claim is the normal level of people quitting jobs voluntarily. Data released today by the U.S. Bureau of Labor Statistics seems to signal the end of what was termed as the “Great Resignation”.
The number of quits for May 2024 was 3.5 M, BLS reported. This figure shows little change over the month, but it is significant when compared to the Pandemic Years 2020 and 2021 because the number is no longer outstanding from the average value. A simple test sheds light to the interpretation of today’s figure.
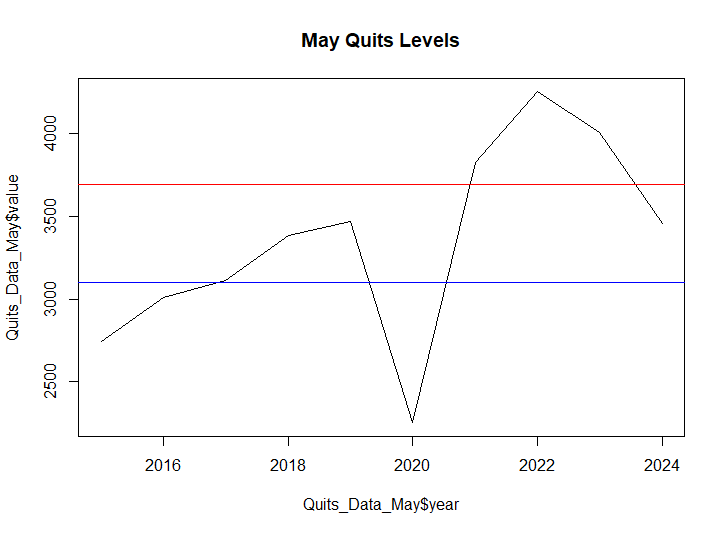
Technically, a one sample t test shows the current value (reported in Millions) 3459 is not statistically different than its long run (2015-2024) average, which equals 3397. The yielded t statistics equals -0.39 with a p-value equal to .70. A 90% confidence interval shows lower limit 3102 while an upper limit of 3691.
The plot below shows how the yearly trend went back down to the confidence interval region of what we would consider normal variation for the Quits levels.
Code Refactoring Services. Make an Appointment
When Quits are high, knowledge about your scripts goes away with your employees. As a data analytics leader, you must make sure the organization’s programs are portable from one analyst to other. Econometricus specializes in transforming/updating scripts so new hires/analysts can hit ground running with a well commented, easy to read, and clean code.


Would the latest trend in quits give employers an advantage on salaries and remote work?
Implications of the large picture are still uncertain. However, one could argue that the latest data may support stricter policies against remote work. Furthermore, the data may also show a slight slowdown from the hype in hiring, which is a metric Monetary Policy Analysts are tracking to support cuts in interest rates, thereby spilling over mortgage interest rates.
The following script generates our results:
###########################################
###                                    ####
### May 2024 Quits Levels Comparison   ####
###                                    ####
###########################################

library(blsR)

#
# Get Quits Series Data from BLS
#

Quits_Data                         <- blsR::get_series_table("JTS000000000000000QUL", start_year = 2015, end_year = 2024, api_key = "XXXXXXXXXXXXXXXXXXXXXXXXXXXXXX")
Quits_Data_May                     <- as.data.frame(subset(Quits_Data, Quits_Data$periodName=="May"))
Quits_Data_May$Yearly_Change       <- NA
Quits_Data_May$Yearly_Change[1:9]  <- base::diff(Quits_Data_May$value, differences = 1)

#
# Find Mean values on a year basis by excluding 2020 and 2021
#

Mean_Values             <- aggregate(Quits_Data[,c("value")], list(Quits_Data$year), FUN= mean)

Mean_Values_No_Pandemic <- subset(Mean_Values, Mean_Values$Group.1 != "2020")
Mean_Values_No_Pandemic <- subset(Mean_Values_No_Pandemic, Mean_Values_No_Pandemic$Group.1 != "2021")

#
# Single out the current value released by BLS
#

May_2024                <- Quits_Data_May$value[Quits_Data_May$year=="2024"]
May_2023                <- Quits_Data_May$value[Quits_Data_May$year=="2023"]

#
# Test the hypothesis that the current value is significally different than the average no Pandemic
#

t.test(Mean_Values_No_Pandemic$value, alternative = "two.sided", mu=May_2024, conf.level = .90)
t.test(Mean_Values_No_Pandemic$value, alternative = "two.sided", mu=May_2023, conf.level = .90)

#
# Plot the series
#


plot(Quits_Data_May$value ~ Quits_Data_May$year, type = "l", main= "May Quits Levels")
abline(h=3102, col="blue")
abline(h=3691, col="red")
Categories: Macroeconomics

2 replies »