County level unemployment rates are estimated by applying the following formula to data collected from different sources:
Unemployment Rate = Number of Initial Unemployment Insurance Claims + Number of Unemployed People / Number of People in the Labor Force
1) The calculation requires the most current data on the number of people who have been separated from jobs, and, although BLS and Census Bureau’s surveys are useful providers of such data, it take time and resources to gather and approximate a number. Therefore, a common proxy to substitute expensive surveys is the number of Unemployment Insurance Claims filed at the Maryland Department of Labor.
2) The calculation also requires both the number of workers in the job market, and the number of unemployed workers at the county level. These data point are pulled form the Bureau of Labor Statistics yearly estimates on Labor Force Participation.
3) The estimated number of unemployed workers at the county level is the output of the following mathematical above. Also, the Unemployment Rate is a function of population growth, which can stem from any influx of migrant people (national or international). The statistics of population growth are take as given as the current day.
At Econometricus we approximate Unemployment Rates at the County Weekly level following all these steps. In the button above you can find an automation tool that runs the algorithm. The web application outputs the latest trend in both rate and unemployment insurance claims to provide a view into the local area unemployment. A typical output comprises a table indicating the County Name and its corresponding Rate.
| County Name | Unemployment Rate |
Worcester County Maryland | 4.3 |
Allegany County Maryland | 4.4 |
Baltimore city Maryland | 4.2 |
Cecil County Maryland | 3.4 |
Baltimore County Maryland | 3.3 |
Carroll County Maryland | 2.5 |
Calvert County Maryland | 2.7 |
Dorchester County Maryland | 3.7 |
Anne Arundel County Maryland | 2.7 |
Frederick County Maryland | 2.6 |
Prince George’s County Maryland | 3.4 |
Howard County Maryland | 2.7 |
Garrett County Maryland | 3.5 |
Montgomery County Maryland | 2.7 |
Queen Anne’s County Maryland | 2.5 |
Talbot County Maryland | 3.4 |
Wicomico County Maryland | 3.4 |
Somerset County Maryland | 4 |
Harford County Maryland | 2.9 |
St. Mary’s County Maryland | 2.7 |
Kent County Maryland | 3.6 |
Charles County Maryland | 3.2 |
Washington County Maryland | 3.4 |
Caroline County Maryland | 3.1 |
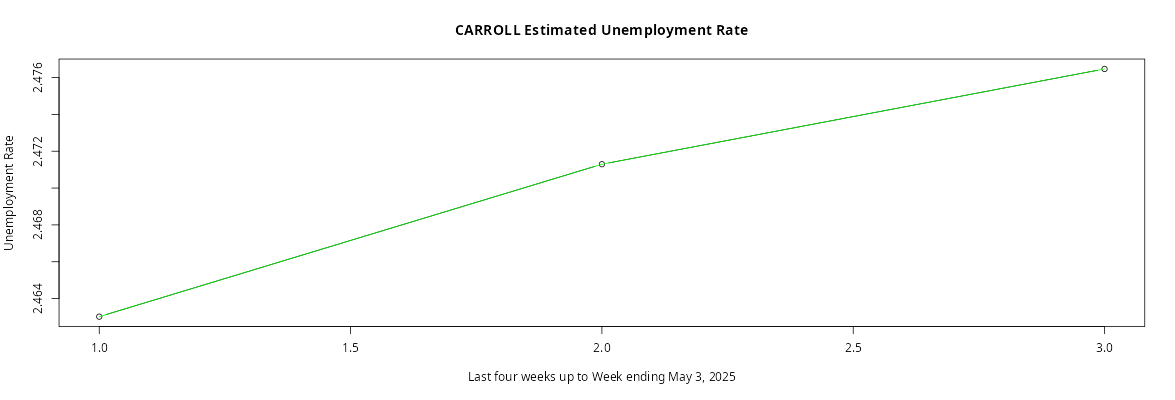
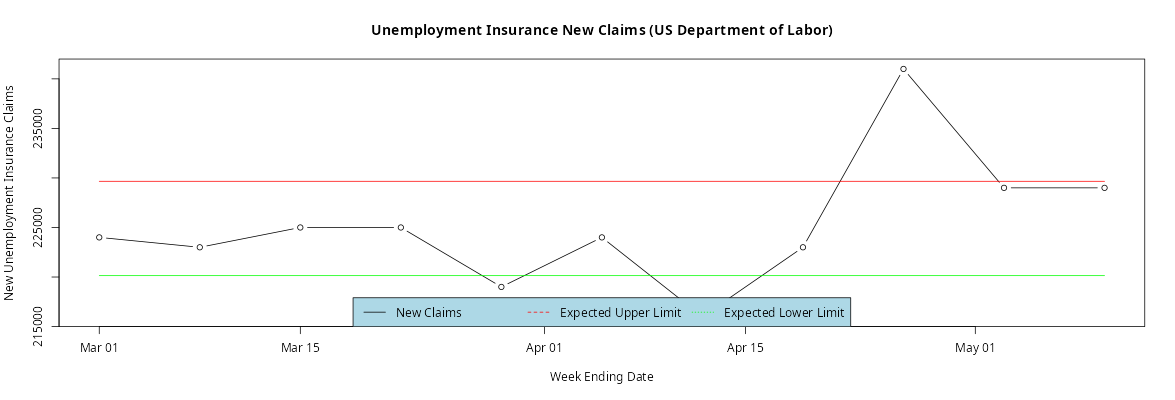
Also the latest trend on the same estimates for both the rate and the unemployment insurance claims plotted in charts like these:
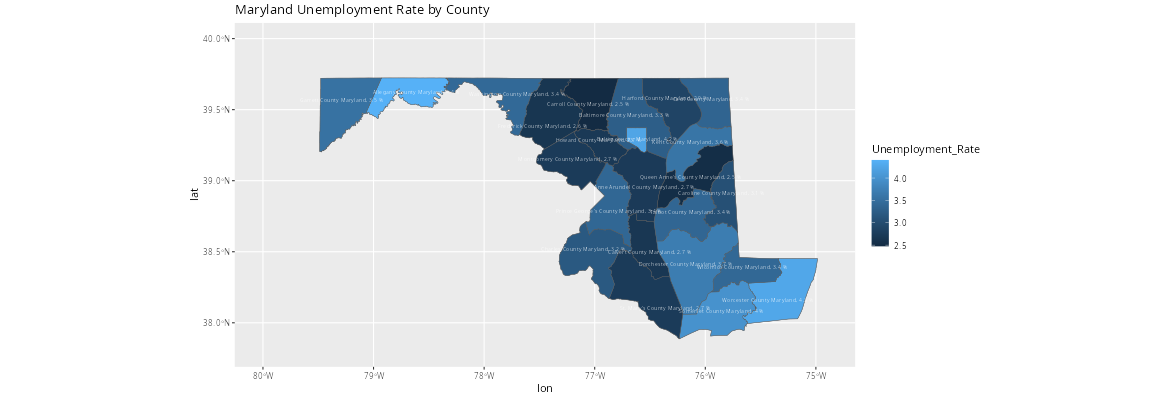
And finally, the tool plots a map showing the different counties and their rates leveraging a color scale like in this map below:
Categories: Services and Consulting
