1. Introduction:
Recent events in U.S. policing have once again heightened awareness of the use of excessive force. From the early days of the Black Lives Matter movement to recent fatal encounters in Minnesota, the demand for professionalized departments grows alongside questions of how to achieve an unbiased, balanced approach to policing. To address this need, our client proposes two hiring standards aimed at objectively assessing both the training and the professional affiliations of prospective officers. The paper concludes that, for instance, a former ICE agent seeking a law enforcement related position within the county must be deemed as disqualified for the position, while a former Pennsylvania Police Department officer would be preferred.
Ignoring low training and low agency accountability standards in officer hiring processes pose unnecessary risks for municipalities. Our client reviews proposed county actions to identify potential financial and legal risks; our role is to ensure that county decisions protect taxpayers and do not expose the county to unnecessary liability. The hiring or contracting of poorly trained agents raises several concerns, including potential legal exposure, uncertain long-term funding, and the additional operational costs required to manage and supervise policing programs.
This paper begins by contextualizing the issue with brief accounts of recent instances of excessive force and selected data on police misconduct settlement costs. The second section describes two observable metrics and the datasets used to derive insights. Finally, the third section presents the results, followed by an analysis of risks, policy recommendations, and general conclusions. The paper relies on factual data from three sources: the Census of Law Enforcement Training Academies (2022), the Police Scorecard Project (2022), and Settlements from the National Police Database.
Police Misconduct Overview:
Settlement Compensation may be used as a proxy for understanding risks and liabilities incurred by municipalities after hiring a unqualified law enforce officers. For instance, from 2009 to 2024, selected police misconduct cases averaged more than $1 million each. According to an analysis of 366 selected cases (Appendix 1), the mean value per case is $3,878,315, while the median is $900,000. Some victims have received remarkably high awards; in a case, a federal jury in Atlanta awarded $100 million to Jerry Blasingame in August 2022. Other major recent cases include Nathen Jones in Chicago ($45 million in 2024) and Randy Cox in New Haven ($45 million in 2023). Aggregated data reveals that Illinois, California, and Georgia are the top three states for settlement payouts. In our dataset, states such as Pennsylvania and Texas have spent approximately $24 million each. Map 1 and Table 1 below rank the states by their total payout amounts.
Map 1
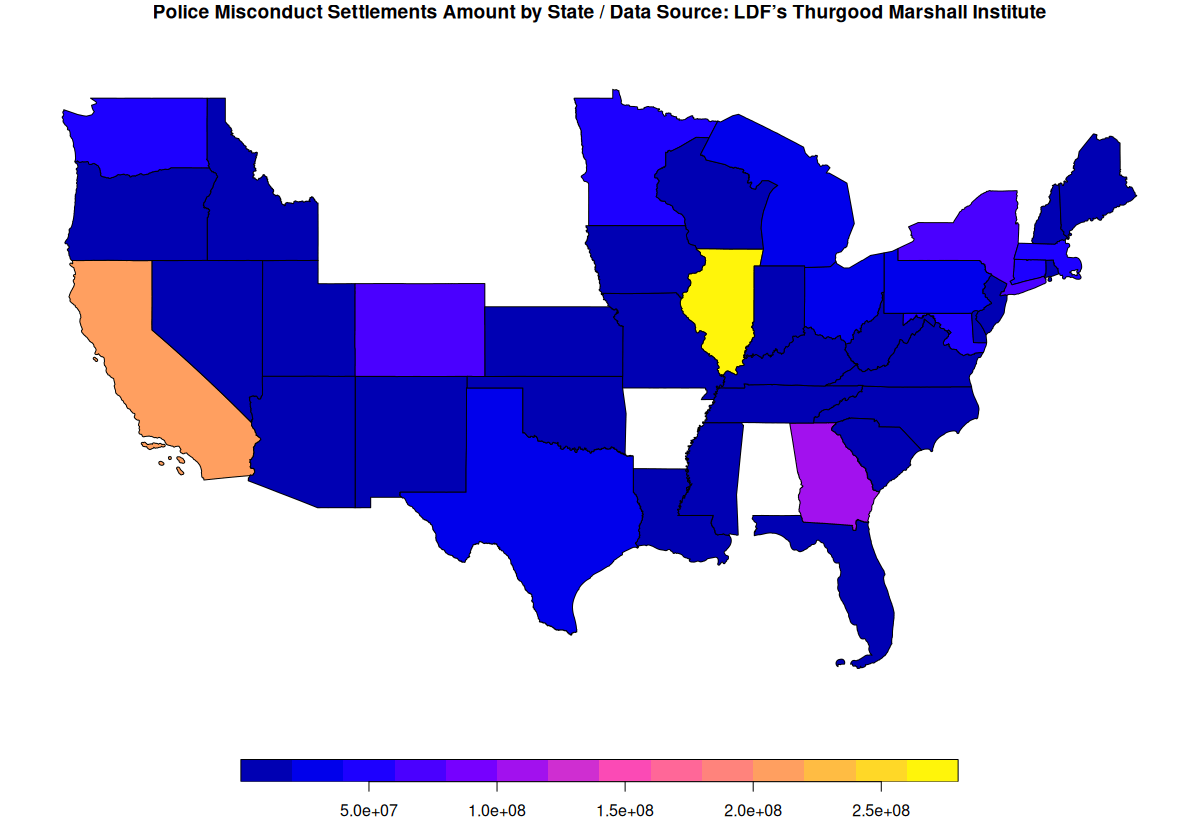
Table 1
| Rank | State | Amount |
| 1 | Illinois | 270,755,000 |
| 2 | California | 200,530,000 |
| 3 | Georgia | 115,965,000 |
| 4 | New York | 76,324,000 |
| 5 | Colorado | 53,442,000 |
| 6 | Maryland | 53,184,000 |
| 7 | Massachusetts | 50,677,497 |
| 8 | Minnesota | 49,637,900 |
| 9 | Connecticut | 45,749,500 |
| 10 | Washington | 44,457,500 |
| 11 | Michigan | 32,200,000 |
| 12 | Texas | 30,198,300 |
| 13 | Pennsylvania | 25,800,000 |
| 14 | Ohio | 24,605,000 |
| 15 | Kansas | 19,025,000 |
Instances of excessive force. The case of ICE:
To qualitatively illustrate the extent of law enforcement’s use of force, this introduction lists five cases involving Immigration and Customs Enforcement (ICE). Between 2014 and 2019, ICE agents were involved in fatal shootings across various states, ranging from arrests of suspects with alleged weapons to incidents involving fleeing suspects. These cases, occurring in Georgia, North Carolina, Arizona, and Texas, highlight scenarios involving armed robbery, narcotics investigations, and warrant services.
Case 1: On February 17, 2019, 45-year-old Johnathan D. Liddell was fatally shot by off-duty ICE agent Othello Lamar Jones in a Lithia Springs, Georgia, Walmart parking lot. While witnesses stated Liddell remained inside his vehicle, Jones claimed he fired in self-defense and removed an airsoft gun from the car after the shooting.
Case 2: On August 25, 2018, in Charlotte, North Carolina, 30-year-old Donald Janvier was killed by an ICE agent following a bar fight. After the altercation moved outside, Janvier reportedly struck an agent with his vehicle, causing a leg fracture and prompting the agent to fire through the windshield.
Case 3: On May 8, 2018, 23-year-old Giovanny Leon was shot and killed by an ICE special agent during a narcotics investigation in Mesa, Arizona. Official reports state the shooting occurred after
Leon approached an undercover agent, brandished a handgun, and attempted a robbery.
Case 4: On May 1, 2018, in San Antonio, Texas, Enforcement and Removal Operations (ERO) agents fatally shot a suspect who fled during a warrant service. According to the FBI, the suspect opened fire on agents during a pursuit, leading to the fatal return fire.
Case 5: On March 2, 2018, 48-year-old Erik Christopher Dunham was killed by ICE agents in a Scottsdale, Arizona, parking lot. Dunham, who had failed to appear for sentencing on a human trafficking conviction, allegedly pulled a handgun when approached by agents.
2. Methodology:
This section describes the two metrics used to establish hiring standards and the datasets leveraged for this analysis. The assessment is guided by two primary indicators: Training and Past Professional Affiliations.
- Basic Training Hours: The number of core basic training hours completed by a candidate’s academy, categorized by the
BASIC_REQvariable quartile range. - Agency Fatal Force Record: The percentage of an organization’s fatal force incidents that were considered “unjustified” or “sustained” as misconduct, relative to the total reported deaths in the dataset.
The goal is to provide hiring managers with benchmark data to determine how a candidate’s previous training and agency experience rank against national counterparts. For example, if a candidate attended Academy “ABC,” the hiring manager can determine if that program’s required hours fall above or below the national average. Similarly, if a candidate has prior experience at Agency “XYZ,” the manager can review that agency’s historical data on fatal force and accountability to make a more informed hiring decision.
Average Value of Basic Required Training:
To estimate the average required training hours, this methodology utilizes the 2022 Census of Law Enforcement Training Academies (CLETA) from the U.S. Bureau of Justice Statistics. Specifically, we analyzed the BASIC_REQ variable, which represents the mandated hours for a core basic training program as of December 31, 2022. The survey dataset includes 857 records; after excluding 247 missing (NA) entries, the methodology utilizes the 610 complete observations. From this subset, we estimated a 90% confidence interval for the mean and a percentile range across ten types of academies, including two-year colleges and state police agencies.
Law Enforcement Fatal Force and Accountability:
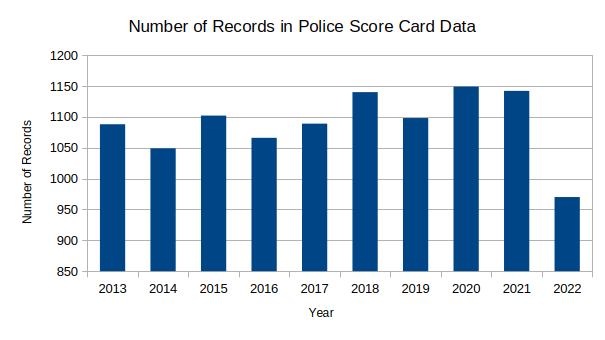
To approximate the percentage of unjustified force incidents, the methodology employs data from the Police Scorecard Project (2022). This dataset provides comprehensive figures on justified, unjustified, and pending cases, covering more than 8,500 records from 2013 to 2022.
Chart 1
More precisely, our methodology classifies over 8,500 pending cases as either “Appearance of Justified” or “Appearance of Unjustified” using the following five-step algorithm:
1. Narrative Construction: The algorithm creates a combined narrative for each fatality by concatenating pre-processed values from several key columns: Initial Reported Reason for Encounter (e.g., “traffic,” “domestic violence”), Armed/Unarmed Status (e.g., “Allegedly Armed”), and the Alleged Threat Level (flagging whether the officer was attacked). We also incorporate weapon details, symptoms of mental illness, and a simplified version of the Brief Description of Circumstances. Finally, we include the Official Disposition of Death.
Examples of constructed narratives:
- “property abatement issue, threatening code enforcement with a gun, aggravated assault, armed, attacked, lethal, gun, noninfluence, warrant lacked”
- “theft, armed, attacked, knife, noninfluence, warrant lacked”
2. Topic Modeling: The algorithm applies a Latent Dirichlet Allocation (LDA) model to identify at least fifteen thematic structures within the constructed narratives.
3. Human Analysis: A designated analyst reviews the thematic output and classifies each topic. For example, topics involving an “attack with a lethal gun” are classified as “Appearance of Justified,” while “no attack/other weapon” may be flagged as “Appearance of Unjustified” (see Table 2).
Table 2
| Topic | Case Description | Prevalence | Coherence | Analyst’s Assessment |
| t_1 | attacked_lethal_gun_noninfluence | 10.41 | 0.46 | Appearance of Justified |
| t_2 | check_armed_attacked | 1.73 | 0.46 | Appearance of Justified |
| t_3 | attacked_lethal_gun_underinfluence | 5.45 | 0.66 | Appearance of Justified |
| t_4 | noattacked_otherarm_underinfluence | 3.88 | 0.49 | Appearance of Un_Justified |
| t_6 | noattacked_knife_underinfluence | 3.47 | 0.81 | Appearance of Justified |
| t_7 | armed_attacked_knife_noninfluence | 3.46 | 0.79 | Appearance of Justified |
| t_8 | lethal_vehicle_underinfluence | 1.81 | 0.16 | Appearance of Un_Justified |
4. Case Classification: Based on the analyst’s thematic input, the model assigns each individual case to either the “Appearance of Justified” or “Appearance of Unjustified” category.
5. Scoring: Finally, the Law Enforcement Organization’s Percentage of “Appearance of Unjustified” Deaths is calculated by determining the share of cases flagged as unjustified relative to the total number of incidents.
3. Results:
Average Required Basic Training Hours:
The mean value for required basic training is 804.6 hours. At a 90% confidence level, the confidence interval ranges from a lower limit of 789.6 to an upper limit of 819.5. The minimum number of training hours recorded in the dataset is 71, while the maximum is 1,664. The median value, representing the 50th percentile of observations, is 770 hours. Tables 3 and 4 summarize these results for all academies and by specific agency type.
Table 3
| BASIC_REQ | Value |
| Average | 804.6 |
| 90 percent confidence interval lower limit | 789.6 |
| 90 percent confidence interval upper limit | 819.5 |
Table 4
| Agency Type | Average | Minimum | First Quartile | Median | Third Quartile | Maximum | NAs |
| State POST or equivalent | 665.4 | 200 | 561.25 | 640 | 781.75 | 1064 | 23 |
| State police/highway patrol | 966.6 | 408 | 800 | 1021 | 1160 | 1464 | 18 |
| Sheriff’s office | 730.3 | 120 | 543.5 | 720 | 920 | 1184 | 33 |
| County Police Dept. | 1015.3 | 408 | 891.5 | 1036 | 1185 | 1500 | 11 |
| Municipal Police Dept. | 932.0 | 160 | 740 | 920 | 1094.5 | 1664 | 57 |
| 4-year university | 761.6 | 366 | 634 | 760 | 838.75 | 1250 | 34 |
| 2-year college | 758.9 | 320 | 679.75 | 745 | 800.5 | 1536 | 74 |
| Technical school | 689.7 | 71 | 709.5 | 737 | 767.5 | 800 | 23 |
| Special jurisdiction agency | 984.2 | 80 | 900 | 1024 | 1250 | 1397 | 15 |
| Multi-agency | 761.2 | 238 | 674.25 | 775 | 870 | 1132 | 22 |
| All | 804.6 | 71 | 680 | 770 | 933.5 | 1664 | 247 |
Agency Percentage of “Appearance of Unjustified” Deaths:
To generate empirical results, we ran the LDA topic model using the parameters detailed in Table 5.
Table 5
| topic | label_1 | prevalence | coherence | Analyst Assessment |
| t_1 | attacked_lethal_gun_noninfluence | 6.39 | 0.313 | Apperance of Justified |
| t_2 | noattacked_otherarm_noninfluence | 3.47 | 0.42 | Apperance of UnJustified |
| t_3 | noattacked_knife_noninfluence | 5.7 | 0.793 | Apperance of UnJustified |
| t_4 | armed_noattacked_knife | 3.77 | 0.644 | Apperance of UnJustified |
| t_5 | attacked_otherarm_underinfluence | 2.87 | 0.565 | Apperance of UnJustified |
| t_6 | erratic_behavior_armed | 2.12 | 0.401 | Apperance of UnJustified |
| t_7 | unarmed_noattacked_otherarm_noninfluence | 10.21 | 0.727 | Apperance of UnJustified |
| t_8 | attacked_lethal_gun_noninfluence | 10.47 | 0.411 | Apperance of Justified |
| t_9 | armed_attacked_knife_underinfluence | 2.05 | 0.598 | Apperance of UnJustified |
| t_10 | gun_armed_noattacked | 1.46 | 0.426 | Apperance of UnJustified |
| t_11 | hostage_situation_armed | 1.37 | 0.376 | Apperance of Justified |
| t_12 | attacked_lethal_gun_underinfluence | 5.82 | 0.69 | Apperance of Justified |
| t_13 | attacked_otherarm_noninfluence | 6.82 | 0.303 | Apperance of Justified |
| t_14 | attacked_lethal_gun_noninfluence | 7.68 | 0.496 | Apperance of Justified |
| t_15 | noattacked_lethal_gun | 2.84 | 0.45 | Apperance of Justified |
| t_16 | gun_noninfluence_warrantbacked | 3.28 | 0.682 | Apperance of Justified |
| t_17 | noattacked_lethal_gun_noninfluence | 11.3 | 0.584 | Apperance of UnJustified |
| t_18 | armed_attacked_knife_noninfluence | 3.34 | 0.859 | Apperance of UnJustified |
| t_19 | noattacked_lethal_gun_underinfluence | 3.68 | 0.4 | Apperance of UnJustified |
| t_20 | lethal_vehicle_noninfluence | 5.38 | 0.584 | Apperance of Justified |
To generate insights on specific agencies, we selected three organizations: U.S. Immigration and Customs Enforcement (which appears in the data alongside the U.S. Marshals Service), the Pennsylvania State Police, and the Allentown (PA) Police Department. The model is intended to provide a high-level overview of cases related to a given agency rather than a definitive legal judgment. Table 6 displays the classification results for these selected agencies.
Table 6
| Agency | DeathClass | Counts | Total_Cases | Share |
| Pennsylvania State Police Department | Apperance of Justified | 34 | 14 | 0.54 |
| Pennsylvania State Police Department | Apperance of UnJustified | 29 | 14 | 0.46 |
| Allentown Police Department | Apperance of Justified | 2 | 3 | 0.67 |
| Allentown Police Department | Apperance of UnJustified | 1 | 3 | 0.33 |
| U.S. Immigration and Customs Enforcement | Apperance of Justified | 3 | 7 | 0.38 |
| U.S. Immigration and Customs Enforcement | Apperance of UnJustified | 5 | 7 | 0.63 |
4. Policy Recommendations and Conclusions:
This policy paper defined two metrics as proxies to gauge professionalism among law enforcement job seekers. First, the Average Value of Basic Required Training, and the Agency Percentage of “Appearance of Unjustified” Deaths. The two standards aim at providing data and context to hiring managers by enabling cross candidate comparisons, which may lead to a decrease in officer misconduct incidents. The proposed standards unbiasedly summarize the notoriety of the received training as well as the acquired experience of job candidates.
As the final outcome of implementing the two standards is filtering job candidates by the score received from the data, unfair practices of class discrimination are avoided insofar as the standards are applied to all and every organization with a record in the data. Likewise, the representativeness of the data is large enough to support hiring process decision as unbiased and likely fair. To the best of our knowledge, the method do not target any particular class of policing organization. However, these statements must be confirmed and endorsed by both a licensed layer as well as a professional in human resources.
It is up to the county leadership to set thresholds for each of the metrics. However, implementing the standards to the U.S. Immigration and Customs Enforcement (ICE) would reject a prospect officer seeking a law enforcement position within the county. Accrediting both training and job experience from such an agency would set the candidate below the average in training hours as per DHS’ training hours of ICE officers is roughly 672, while the national average is 804. Likewise, the percentage of fatal “unjustified” homicides by the agency, accordingly to the data is 63 percent of known cases. Assuming the standards are enacted, in a practical, real life event of a former ICE agent seeking a law enforcement related position within the county, the job candidate must be deemed as disqualified for the position.
Finally, the methodology employed to generate both the metrics and data insights is reproducible for transparency and accountability of the policy. All data, programming scripts, parameters, and formulas are released along with the paper. Any interested user may reproduce the results and evaluate potential bias in the method, data sources, or the analysis itself of the proposed policy.
5. Appendix
1. Settlement Selected Cases
2. ICE Cases Descriptions
3. Police ScoreCard Database
4. Census of Law Enforcement Training Academies (CLETA)
5. Model and Calculations Programming Scripts
Categories: Macroeconomics


 Econometricus.co